In this article, we look at how to make algorithmic trading setup profitable. This is Part-II of our blog on Algorithmic Trading, you can read Part-I which focuses on pros & cons of algorithmic trading.
Maintaining a consistently profitable algorithmic trading setup is a continuous process. Your must always keep on improving your system. Improvements may involve fixing problems, improving returns, reducing costs, adding more strategies, covering more asset classes, reducing risks etc.
Strategy
To build a good performing strategy, you must understand the stocks (instruments) you are trading. You strategy needs to have an edge to beat other traders and algorithms. The only way you will find that edge is by doing analysis. You can do your own analysis, just like a trader & support it with historical data analysis. If you are not a trader, then you can simply start with historical data analysis. In any case, historical data plays a big role in strategy building.
A strategy involves rules & parameters. See example:
Rules:
- Buy when X period moving average crosses over price
- And when RSI (Relative Strength Index) is below Y
- And when live price is below the average low price of previous Z days
- Profit target P%
- Stoploss target S%
Parameters:
- X = 10 (Moving average period)
- Y = 30 (RSI must be below this value)
- Z = 2 (Use average of low price of previous 2 days)
- P = 3% (Profit target)
- S = 2% (Stoploss target)
Backtesting
Trading with a strategy that is not backtested, is like going to a gun fight with empty hands. Backtesting is a process of testing your strategy on historical data. You will need to use software for doing backesting.
Advantages
- Gives you more confidence as you can see the performance of you strategy in numbers
- Helps you understand the kind of market that suits your strategy better
- For example, your strategy may perform well in trending market. So you may add checks to automatically switch off your strategy when market is not trending
- Helps you identify the flaws in your strategy
- The best way to do this is to manually investigate positions that show extremely high or low pnl in backtesting. This happens mostly when there is a bug or a flaw in your strategy
- Helps you optimize returns
- You can modify your strategy rules/parameters by analyzing backtesting results
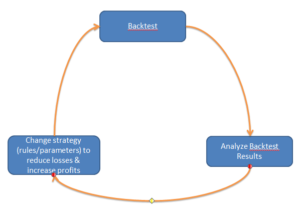
Optimization
Strategy optimization involves modifying strategy rules and/or parameters to improve returns. Take a look at the optimization cycle:
Now let us understand strategy optimization in detail.
Let us assume we backtested for 1 year for a single stock & our strategy is intraday strategy. Now let’s see what should we look for in the backtest results:
- Did we get total positions as expected? There are approximately 255 trading days in a year.
- If we expect our strategy to generate positions on at least 100 trading days & backtesting only shows 40.
- Figure out why are we trading less (May be RSI below 30 needs to be moved to below 50)
- If we get too many positions (say 200), then
- Count winning & losing positions
- If more losing positions, then analyze them and see what changes we can make to avoid these losing positions or at least to reduce losses
- If we expect our strategy to generate positions on at least 100 trading days & backtesting only shows 40.
- Find positions with extremely high profit or loss
- Manually analyze these positions to make sure our strategy does not have any flaws/bugs
- Fix any problems that you may find
- Are only few positions generating most of the losses? See example:
- Backtesting gave us (say 100) positions, with a total net P&L of 1,00,000/-
- Total losing positions = 20, total loss = 40,000/-
- Total winning positions = 80, total profit = 1,40,000/-
- You can see we have 80% winning ratio, but remaining 20% is causing us way too much loss. Analyze these 20 positions to find a way to reduce losses
- Are we exiting the position properly? Example:
- Are we taking early profit? Should we increase profit target?
- Are we booking early loss? Should we increase stoploss target?
- Any other observations based on our data analysis? Example:
- High volume indicates strong trend? If yes, then increase profit target only when you see heavy volume
- Can we reduce the orders that are being generated by the system without affecting performance?
- Less trading is good, as it will save our money on transaction costs (brokerage, taxes etc.)
What changes to make will vary based on your strategy, number of stocks, diversification required etc. So it is vital to understand your strategy as well to have decent knowledge of the market you are trading.
Once you do the changes, perform another round of backtesting. This cycle continues until you reach a point where you are happy with results & confident to go live.
Risk Management
In a typical trading firm, you have an experienced trader who monitors a team of junior traders. If any of his junior traders makes a mistake, then he jumps in and takes appropriate action.
In algorithmic trading setup, your strategies work as junior traders & risk management component plays a role of an experienced trader. It is very important that Risk Management component must be independent of trading strategies.
Trading strategies also perform risk checks, but Risk Management component performs more generic risk checks & has higher authority. It’s role is to catch a trading strategy that is going rogue. In simple words, any trading strategy that is behaving abnormally must be caught & reported by Risk Management component. It is also responsible to take actions to avoid heavy losses. For example, it can disable trading for a particular strategy if it fails the risk checks.
Let us look at some typical checks that Risk Management component can do:
- Maximum limit on position stoploss (Example 10% loss). Strategies can have their own stoploss (example 3%, 5% etc.). But for some reason (Say, due to code issues), if the stoploss order was not entered by the strategy. Then this component enters stoploss order.
- Maximum limit on portfolio stoploss (all positions combined). Example: Maximum of (3% portfolio value OR 15,000/-). There are days when market moves completely against your strategies, on such days this rule can avoid extreme losses.
- Maximum limit in a sector (Example, a maximum 30% of the total capital can be invested in a single sector like auto, pharma, IT etc.)
- Set maximum limit on stock position. Example, total value of a position in any stock must not go beyond 50,000/-
- Set maximum limit on the portfolio. Example, total value of all positions in a portfolio must not go beyond 25,00,000/-
- Set maximum limit on the orders. Example, total value (quantity * price) of any order must not go beyond 50,000/-
- Minimum hedge ratio
- Set LONG/SHORT bias: Example, you can say that once the LONG portfolio value goes say beyond 20,00,000/-; then the portfolio must maintain at least 40% SHORT positions. It means that after 20,00,000/- the system will only accept SHORT orders and reject LONG orders until the SHORT value of portfolio reaches at least 8,00,000/- after which new longs will be accepted.
- Stock circuit safety. If you have sold SBIN @ 100 (intraday), and price closes the upper circuit (say 110), then as per this rule this position is immediately squared off.
- Limit the stocks that are allowed to trade. Example, do not allow trading in stocks with very high volatility, penny stocks or stocks with small circuit range
Conclusion
Making a consistently profitable algorithmic trading system is an art. It requires continuous efforts, good understand of markets, portfolio & risk management concepts, programming etc.
How to implement Risk Management component in Amibroker?
March 3, 2018 at 5:08 amWe will soon support strategy execution and risk management inside AutoTrader. Implementing it in Amibroker is not easy.
April 12, 2018 at 6:20 pmIs risk mananagement implemented in amibroker?
August 29, 2018 at 2:48 pmNo, but you can code it as per your requirements
August 30, 2018 at 3:18 amHow can you get values of: Margin used, Free Margin, Upper n Lower circuit values of each Symbol, in the code?
September 15, 2018 at 2:03 pmhttps://stocksdeveloper.in/autotrader-functions
See above link. Circuit limits are not available as of now.
September 26, 2018 at 11:43 amI’m new to algo trading and have a doubt. If I input resistance , support levels and target level into auto trader looking at kite chart , do I still need amibroker ? I mean ..can auto trader work with zerodha kite without amibroker ?
November 29, 2018 at 4:53 amNo, AutoTrader cannot work with Kite charts.
November 29, 2018 at 7:00 am