Summary
One rolled-up view of positions, orders and margins across all your accounts.
The Summary tab gives you one combined view of all the trading accounts added in your system. It rolls up positions, orders and margins together, so you can check the whole picture at a glance. It also breaks down your exposure, derivatives and holdings, and draws your day's profit or loss as a live curve. The account and symbol tables sit at the top, and you can drag any panel by its header to arrange the tab the way you like. To focus on a single account, pick it from the dropdown at the top.
What the Summary tab shows
This tab shows a combined summary of all your trading accounts in one place. To look at a specific account instead, select it from the dropdown menu at the top.
The summary is grouped into three parts: positions, orders and margins.
Positions summary
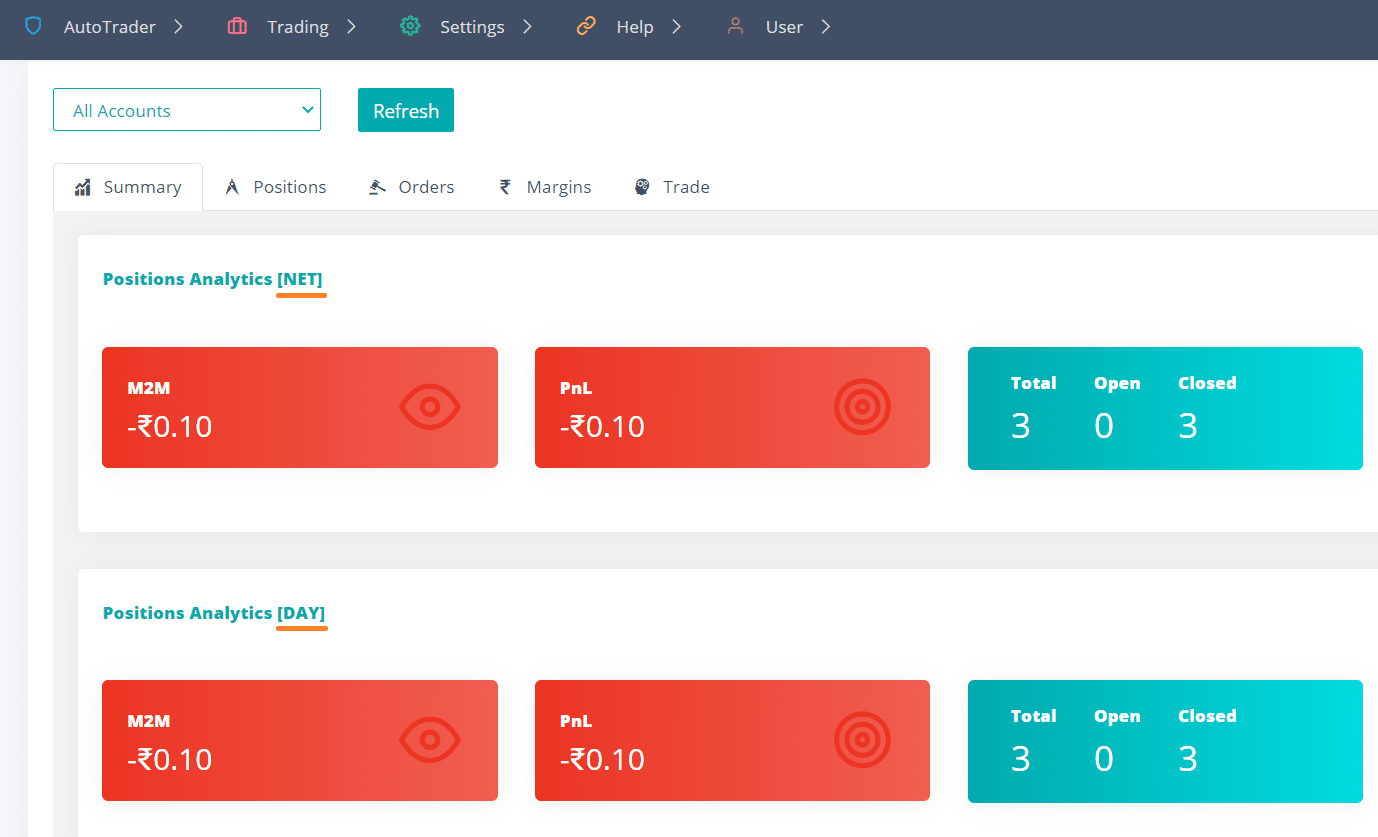
The positions summary shows both NET and DAY values across your accounts.
Orders summary
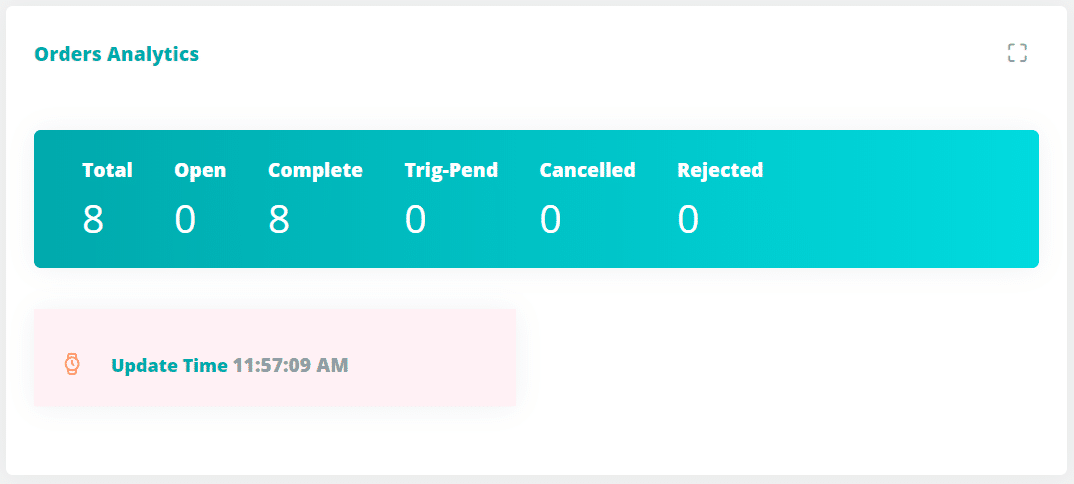
The orders summary brings together orders from all your accounts.
Margins summary
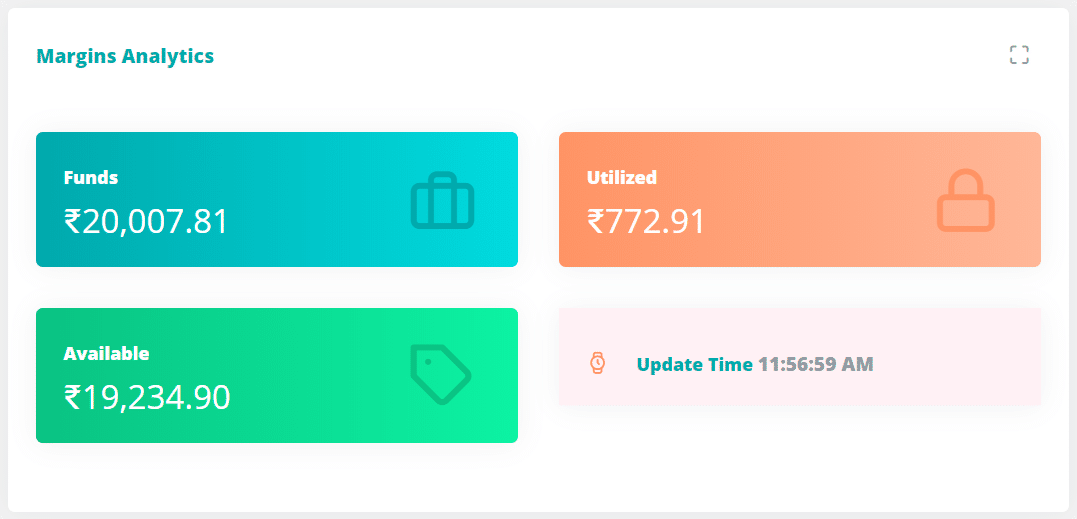
The margins summary shows available and used margin across your accounts.
Summary strip (top)
At the top of the tab is a strip of key numbers, added up across all your accounts. It stays visible all the time.
| Item | Meaning |
|---|---|
| Today’s trades · AT PnL | Profit or loss on only the trades you did today, worked out by our system, updating live as prices move. It leaves out anything you carried from an earlier day, so it can keep moving after you close a carried position — see why the day PnL keeps changing. Shows a dash (—) when your broker does not send a day view. |
| Net · AT PnL | Your total profit or loss, including carried-over positions, worked out by our system. Also live. This is the one that matches your broker app. |
| Net · M2M / PnL | Mark-to-market and profit or loss across all accounts, as of the last load. If you carried a position into today, M2M is your real profit or loss for the day, measured from the previous day’s closing price. |
| Margin | How much margin is used out of your total, with the free amount shown. |
| Alerts | Quick warnings, such as the number of rejected orders, or accounts that did not fully load. |
The strip also shows the time it was last updated, a small line chart of your day’s profit or loss, and an info button (ⓘ) that explains how each number on the Summary is worked out.
Only the PnL/price numbers and charts keep ticking on their own. The tables and counts are loaded when you open the tab, and do not pick up new orders or positions by themselves — including ones placed from another device, another browser tab, or directly with your broker. Click Refresh, or switch to another tab and back, to bring in anything new.
Account summary table
This table has one row per trading account, with columns grouped into sections.
| Group | Columns |
|---|---|
| Account | Nickname, Trading Acc |
| Position [NET] | M2M, PnL, AT PnL, #Total, #Open, #Closed |
| Margin | Total, Utilized, Available |
| Orders | #Total, #Open, #T-Pend (trigger-pending), #Complete, #Rejected, #Cancelled |
| Holdings | #Count, PnL, Curr Val, Total Qty, Quantity, T1 Qty |
| Position [DAY] | M2M, PnL, AT PnL, #Total, #Open, #Closed |
A # means a count (for example #Open is the number of open positions).
Symbol summary table
This table has one row per symbol, rolled up across all accounts.
| Group | Columns |
|---|---|
| Symbol | Exchange, Symbol |
| Position [NET] | Buy Qty, Sell Qty, Net Qty, M2M, PnL, AT PnL, Buy Val, Sell Val, Net Val, Buy Avg, Sell Avg |
| Holdings | PnL, Curr Val, Total Qty, Quantity, T1 Qty |
| Position [DAY] | Buy Qty, Sell Qty, Net Qty, M2M, PnL, AT PnL, Buy Val, Sell Val, Net Val, Buy Avg, Sell Avg |
Exposure and attribution
Further down is a set of charts that break down your open positions:
- PnL by underlier — profit or loss grouped by the underlying stock or index.
- Exposure map — one block per underlier; bigger blocks mean more exposure, and the colour shows profit or loss.
- Long vs short — how much of your exposure is on the long side versus the short side.
- Mix — a split of your exposure across cash, futures and options, and commodities.
These charts update live as prices move.
Accounts at a glance
Below the charts is a row of small cards, one for each trading account you loaded. Each card shows:
- The account nickname and the broker.
- The day’s profit or loss for that account.
- How much of its margin is being used.
- A mark if it is a copy-trading master account, or if it has rejected orders.
Accounts that need your attention come first — for example, an account that did not load fully, one that is close to its margin limit, or one with rejected orders.
If an account could not load fully, its card is highlighted and shows a Retry button. Tapping Retry tries to load just that one account again, without reloading the others.
Derivatives at a glance
If you hold futures or options, this panel breaks them down for you:
- By expiry — your open derivative positions grouped by expiry date, with the nearest expiry first. Each row shows how many positions you hold for that expiry, a bar for the size of the position, and its profit or loss. The row expiring today is marked TODAY.
- Options and futures mix — a quick count of your call options, put options and futures, and how many of your option positions are sold (short).
- Net premium — for your option positions, the premium received on sold options minus the premium paid on bought options.
Tap any expiry row to jump to the Positions tab, already filtered to those positions.
Holdings at a glance
This panel sums up your holdings across all accounts:
- Invested, Current and Overall P&L — what you put in, what it is worth now, and the profit or loss with a percentage.
- Top holdings — the holdings with the biggest overall profit or loss.
- Concentration — how much of your holdings value sits in your top three holdings, so you can see if you are heavily weighted in a few names.
- Notes — the value of any pledged holdings, and a count of holdings that are still settling.
Session profit-and-loss curve
This chart draws your Today’s trades · AT PnL (the profit or loss on only the trades you did today) as a line through the session, so you can see how your day has moved, not just where it stands now. It carries the same meaning as that figure in the top strip, so if you closed a position you carried from an earlier day, read why the day PnL keeps changing.
- Now, Day range and Max drawdown — the latest value, the day’s low-to-high range, and the largest dip from the day’s highest point so far.
- It is built on your device as the day goes on and starts fresh each day.
A small version of this line also appears in the top strip.
Orders and margin
Next to the accounts is a band that sums up your orders and margins across all accounts:
- Fill rate — how many of your orders were completed.
- Order status — a breakdown of completed, open, pending, cancelled and rejected orders.
- Top reject reasons — the most common reasons orders were rejected, such as low funds or price limits, so you can fix them quickly.
- Orders by hour — when your orders were placed through the day.
- Margin use — how much margin is used out of your total, with a note on funds and collateral.
Rearranging the panels
Every panel on this tab can be moved, so you can put what matters most to you at the top.
- Drag a panel by its header and drop it where you want it.
- The account summary and symbol summary tables come first by default. If you would rather see the charts first, drag them up.
- Your arrangement is saved to your account, so it stays the same the next time you sign in, on any device.
Managing many accounts together
If you trade across several accounts, we strongly recommend going through our PMS (Portfolio Management System) tool.
You may also find these related pages helpful:
Frequently asked questions
Does the Summary tab update live?▾
Partly. The PnL numbers and charts that move with price — Today's trades AT PnL, Net AT PnL, the exposure charts and the session curve — update live. The account and symbol tables, and the order/position counts, are loaded when you open the tab and stay as they are after that; they do not pick up new orders or positions on their own. Click Refresh, or switch to another tab and back, to bring in anything new.
Why isn't my Summary showing an order I just placed?▾
The Summary tab only picks up new orders and positions when it loads — when you open it, switch to it, or click Refresh. If an order is placed from another device, another browser tab, or directly with your broker, it will not appear on an already-open Summary tab by itself. Click Refresh, or move to another tab and back to Summary, to bring in the latest.
What does the Retry button on an account card mean?▾
If an account could not load fully — for example, if the broker was slow to respond — its card is highlighted and shows a Retry button. Tapping it tries to load just that one account again, without reloading the others.
Can I see my options and futures in the Summary?▾
Yes. The Summary has a derivatives panel that groups your open futures and options by expiry date, with a count of your calls, puts and futures, and the net premium on your options. Tap any expiry to open just those positions in the Positions tab.
Can I change the order of the panels on the Summary tab?▾
Yes. Drag any panel by its header and drop it where you want it. The account and symbol tables come first by default, and you can move them, or any chart panel, up or down to suit how you work. Your arrangement is saved to your account, so it stays the same the next time you sign in, on any device.
What is the session profit-and-loss curve?▾
It is a line chart of your day's profit or loss, drawn as the session goes on, so you can see how your day has moved. It shows the latest value, the day's range and the largest dip from the day's high. It is kept on your device and starts fresh each day.
Next steps
Thanks for the feedback. Still stuck? Contact support.
Last updated 25 August 2026